 Best Stock Hints Latest Tips To Buy & Invest Best Stocks Today

Written by and copyright © 2005-2017 by Thomas N. Bulkowski. All rights reserved. Disclaimer: You alone are responsible for your investment decisions.
See Privacy/Disclaimer for more information.
Archives
Tuesday 1/17/17. The Week Ahead
My Prediction

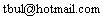
The chart is of the S&P 500 index on the daily scale.
I show two lines. They are not trendlines.
Rather, they endeavor to show the relationship between the length of the rise compared to the length of the horizontal move. My feeling is that the two should
be proportional.
What does that mean? It’s hard to describe, but the two lines look almost proportional to me. I suspect another up move is coming.
The thinking here is that after a steep move upward, the index is going to rest for a time. How long is unknown but it’s often proportional to the move up.
Long upward runs or steep runs will require more of a rest.
I think that maybe a few more days to say, oh, a week and it’ll look like the index is setup for another move, breaking out of the horizontal travel. Let’s just hope the move is up.

A Brief Look Back

The following is a brief review of how the markets performed over time. The numbers refer to the close-to-close move in the Dow industrials.
Monday: Down 76.42 points.
Tuesday: Down 31.85 points.
Wednesday: Up 98.75 points.
Thursday: Down 63.28 points.
Friday: Down 5.27 points.
For the Week…
The Dow industrials were down 78.07 points or 0.4%.
The Nasdaq composite was up 53.06 points or 1.0%.
The S&P 500 index was down 2.3401 points or 0.1%.
Year to Date…
Dow Industrials
0.6% down from the high of 19,999.63 on 01/06/2017.
0.6% up from the low of 19,770.47 on 01/12/2017.
Nasdaq
0.2% down from the high of 5,584.26 on 01/13/2017.
3.3% up from the low of 5,397.99 on 01/03/2017.
S&P 500
0.3% down from the high of 2,282.10 on 01/06/2017.
1.3% up from the low of 2,245.13 on 01/03/2017.
Options Expiration
Many options expire this week, so traders will be looking to close out their positions, and that suggests increased volatility (large daily price swings).
Swing and Position Traders: Chart Pattern Indicator
As of 01/13/2017, the CPI had:
10 bearish patterns,
30 bullish patterns,
350 patterns waiting for breakout.
The CPI signal is 75.0%, which is
bullish (>= 65%).
The chart pattern indicator is bullish
with 1 of 3 full triangles showing ( ). Additional triangles are a measure
of strength with solid triangles meaning a more reliable signal than half triangles.
Swing Traders: Pivot Points
The following is based on an SFO article in December 2004 by John Seekinger, titled, “Take a
two-dimensional approach.” He offers these tips.
| Index | S2 | S1 | Pivot | R1 | R2 |
| Dow Industrials (^DJI): Daily | 19,793 | 19,839 | 19,896 | 19,942 | 19,998 |
| Weekly | 19,674 | 19,780 | 19,877 | 19,983 | 20,079 |
| Monthly | 19,460 | 19,673 | 19,836 | 20,049 | 20,213 |
| S&P500 (^GSPC): Daily | 2,268 | 2,271 | 2,275 | 2,278 | 2,282 |
| Weekly | 2,244 | 2,260 | 2,269 | 2,285 | 2,294 |
| Monthly | 2,215 | 2,245 | 2,263 | 2,293 | 2,312 |
| Nasdaq (^IXIC): Daily | 5,545 | 5,559 | 5,572 | 5,587 | 5,599 |
| Weekly | 5,464 | 5,519 | 5,552 | 5,607 | 5,639 |
| Monthly | 5,298 | 5,436 | 5,510 | 5,648 | 5,722 |
- Seekinger doesn’t look at the range of S2 to R2 as support and resistance levels. Rather, he considers them oversold (S) and overbought (R) areas.
- S2 to R2 range of values across daily, weekly, and monthly periods: If two values are close together then they lend more significance to the area.
- If the market trends on day 1, the odds rise tremendously that the market will be range bound between daily S1 and daily R1 the next day.
- In a quiet market when traders are waiting for an important earnings announcement or economic report, look for daily R1 and S1 levels to hold and for the market to return to the daily pivot.
- A move outside of daily R1 or S1 usually does not mean a breakout.
- The odds suggest that the entire week’s price action will remain between weekly R2 and S2.
- Avoid going long when the market moves above weekly R2 (it’s overbought) and avoid going short when price moves below weekly S2 (oversold).
- Consider going short at weekly R1 or long at weekly S1 with a profit objective of the weekly pivot.
- Consider going long at weekly S2 or short at weekly R2 with a profit objective of weekly S1 or R1, respectively.
Here are the formulas:
Pivot point: P = (H + L + C)/3
First resistance level: R1 = (2 * P) – L
First support level: S1 = (2 * P) – H)
Second resistance level: R2 = P + (R1 – S1)
Second support level: S2 = P – (R1 – S1)
H = high price , L=low price, C=closing price
Consecutive Price Trends
| Index | Consecutive Closes So Far |
% | Comments |
| Dow industrials (^DJI) | 1 week down | 28.8% | The trend may continue. |
| 3 months up | 29.9% | The trend may continue. | |
| S & P 500 (^GSPC) | 1 week down | 27.5% | The trend may continue. |
| 3 months up | 36.9% | The trend may continue. | |
| Nasdaq composite (^IXIC) | 2 weeks up | 33.4% | The trend may continue. |
| 3 months up | 28.2% | The trend may continue. |
How long can an index close higher (or lower) each day? The adjacent table shows how often consecutive up or down closes occur in the indices, based on the most recent trend of closes.
Low percentages suggest the market is overdue to turn (think of it as the likelihood that next week or next month will continue the trend, based on historical performance). Values of 50% mean random, so most percentages will be lower.
The analysis uses data going back 10 years for weekly percentages and 25 years for monthly percentages (or the start of data, whichever is more recent). Any unchanged closing price is interpreted as the end of the string of consecutive up or down closes.
Earnings, Chart Patterns & Industries
Earnings season will be starting in about 0 days.
| Found | Chart Pattern Name |
| 31 | Triangle, symmetrical |
| 10 | Rectangle top |
| 6 | Channel |
| 6 | Pipe bottom |
| 5 | Triangle, ascending |
| 5 | Head-and-shoulders top |
| 4 | Rising wedge |
| 3 | Triangle, descending |
| 3 | Double Bottom, Adam and Adam |
| 3 | Flag, high and tight |
Large numbers of bullish or bearish chart patterns can signal short- to intermediate-term market trends (many bullish chart patterns can mean an uptrend will continue, for example).
However, please realize that the short-term price trend could have changed since the pattern was discovered (this is especially true of pipe tops or bottoms, which are weekly patterns).
The 10 types of most frequently appearing chart patterns in the stocks, indices, and long-only exchange traded funds I follow during the last month are shown in the adjacent table.
The industries I follow were the best (rank 1) and worst performing.
|
— Thomas Bulkowski
Friday 1/13/17. Pattern Trading Setups for the Weekend.
Go to Table.
You can find setups based on a Fibonacci retrace by clicking on the link.
Click the link for a list of symbols from the table.
The following patterns were found manually, so the results may differ from those found using Patternz.
There were 28 patterns found this week (excluding pipe bottoms; pipe tops and bottoms are found looking back 2 weeks) out of 621 stocks searched, or 4.5%. Based on the percentage, the stock market is
trending since few consolidation patterns appear.
I found 3 pipe bottom chart patterns, which is neutral. High numbers of pipe bottoms can signal a bullish move (I see many of them just before a bear market ends or during a bear market rally. Often it means the first bottom of a double bottom has formed. Thus, expect a move down to the second bottom).
Excluding ETFs, there were 20 bullish chart patterns this week and 2 bearish ones with any remaining (5) being undecided.
The ratio of bullish to bearish patterns suggests the market is bullish.
In the table below, the red and green colors are based on the historical breakout direction for the associated chart pattern. If a high and tight flag appears, the start and end dates highlight the flagpole only and not the flag.
More…
— Thomas Bulkowski
Weekly screen for chart patterns ending between 01/05/2017 and 01/12/2017. Many may be still in development. If no securities appear, then I have not identified any new patterns.
Definitions
’Breakout is upward/downward 100% of the time’ means price breaks out up/down by definition, not by statistically measuring the rate.
All numbers assume a bull market and are based on the breakout direction that occurs most often.
3D Systems (DDD)
Industry: Electronics
Industry RS rank: 7 out of 56
Stock RS rank: 279 out of 613
1/12/17 close: $15.65
1 Month avg volatility: $0.63. Volatility stop (for upward breakout): $13.59 or 13.2% below the close.
Change YTD: 17.76%
Volume: 2,714,200 shares.
3 month avg: 2,829,405 shares.Since 2009 bear market, the best buy day (fewest up closes) is Thursday, and best sell day (most up closes) is Monday.
Chart pattern: Pipe bottom reversal pattern from 12/27/2016 to 01/03/2017
Breakout is upward 100% of the time.
Average rise: 45%.
Break-even failure rate: 5%.
Throwbacks occur 44% of the time.
Price hits measure rule target 83% of the time.
Anadarko Petroleum Corp. (APC)
Industry: Petroleum (Producing)
Industry RS rank: 20 out of 56
Stock RS rank: 84 out of 613
1/12/17 close: $71.49
1 Month avg volatility: $1.51. Volatility stop (for upward breakout): $67.98 or 4.9% below the close.
Change YTD: 2.52%
Volume: 3,127,600 shares.
3 month avg: 4,510,651 shares.Since 2009 bear market, the best buy day (fewest up closes) is Monday, and best sell day (most up closes) is Tuesday.
Chart pattern: Broadening top, right-angled and descending continuation pattern from 12/20/2016 to 01/12/2017
Breakout is upward 51% of the time.
Average rise: 28%.
Break-even failure rate: 19%.
Throwbacks occur 52% of the time.
Price hits measure rule target 63% of the time.
Cemex SA de CV (CX)
Industry: Cement and Aggregates
Industry RS rank: 17 out of 56
Stock RS rank: 131 out of 613
1/12/17 close: $8.03
1 Month avg volatility: $0.21. Volatility stop (for downward breakout): $8.48 or 5.6% above the close.
Change YTD: 0.00%
Volume: 10,238,100 shares.
3 month avg: 13,612,386 shares.Since 2009 bear market, the best buy day (fewest up closes) is Monday, and best sell day (most up closes) is Tuesday.
Chart pattern: Rectangle bottom continuation pattern from 12/19/2016 to 01/12/2017
Breakout is downward 55% of the time.
Average decline: 14%.
Break-even failure rate: 16%.
Pullbacks occur 69% of the time.
Price hits measure rule target 50% of the time.
Continental Resources Inc. (CLR)
Industry: Petroleum (Producing)
Industry RS rank: 20 out of 56
Stock RS rank: 173 out of 613
1/12/17 close: $51.37
1 Month avg volatility: $1.66. Volatility stop (for downward breakout): $55.33 or 7.7% above the close.
Change YTD: -0.33%
Volume: 2,641,100 shares.
3 month avg: 2,855,638 shares.Since 2009 bear market, the best buy day (fewest up closes) is Monday, and best sell day (most up closes) is Tuesday.
Chart pattern: Rectangle bottom continuation pattern from 12/15/2016 to 01/06/2017
Breakout is downward 55% of the time.
Average decline: 14%.
Break-even failure rate: 16%.
Pullbacks occur 69% of the time.
Price hits measure rule target 50% of the time.
CRH plc (CRH)
Industry: Cement and Aggregates
Industry RS rank: 17 out of 56
Stock RS rank: 146 out of 613
1/12/17 close: $34.65
1 Month avg volatility: $0.34. Volatility stop (for upward breakout): $33.76 or 2.6% below the close.
Change YTD: 0.79%
Volume: 533,300 shares.
3 month avg: 1,052,362 shares.Since 2009 bear market, the best buy day (fewest up closes) is Friday, and best sell day (most up closes) is Thursday.
Chart pattern: Triangle, ascending reversal pattern from 12/02/2016 to 01/12/2017
Breakout is upward 70% of the time.
Average rise: 35%.
Break-even failure rate: 13%.
Throwbacks occur 57% of the time.
Price hits measure rule target 75% of the time.
Cummins Inc. (CMI)
Industry: Machinery
Industry RS rank: 12 out of 56
Stock RS rank: 155 out of 613
1/12/17 close: $138.56
1 Month avg volatility: $2.37. Volatility stop (for upward breakout): $129.31 or 6.7% below the close.
Change YTD: 1.38%
Volume: 2,600,300 shares.
3 month avg: 1,603,883 shares.Since 2009 bear market, the best buy day (fewest up closes) is Monday, and best sell day (most up closes) is Thursday.
Chart pattern: Channel from 12/16/2016 to 01/11/2017
DJ 15 Utilities (^DJU)
Industry: None
Industry RS rank is unavailable.
1/12/17 close: $657.77
1 Month avg volatility: $7.62. Volatility stop (for upward breakout): $638.37 or 3.0% below the close.
Change YTD: -0.28%
Volume: 37,986,000 shares.
3 month avg: 27,267,188 shares.Since 2009 bear market, the best buy day (fewest up closes) is Wednesday, and best sell day (most up closes) is Thursday.
Chart pattern: Channel from 07/22/2016 to 01/12/2017
Equifax Inc (EFX)
Industry: Information Services
Industry RS rank: 36 out of 56
Stock RS rank: 512 out of 613
1/12/17 close: $120.86
1 Month avg volatility: $1.42. Volatility stop (for upward breakout): $116.33 or 3.8% below the close.
Change YTD: 2.22%
Volume: 508,600 shares.
3 month avg: 872,135 shares.Since 2009 bear market, the best buy day (fewest up closes) is Wednesday, and best sell day (most up closes) is Thursday.
Chart pattern: Channel from 12/07/2016 to 01/12/2017
Everest Re Group Ltd (RE)
Industry: Insurance (Prop/Casualty)
Industry RS rank: 19 out of 56
Stock RS rank: 122 out of 613
1/12/17 close: $219.78
1 Month avg volatility: $2.77. Volatility stop (for upward breakout): $212.42 or 3.4% below the close.
Change YTD: 1.56%
Volume: 268,900 shares.
3 month avg: 308,911 shares.Since 2009 bear market, the best buy day (fewest up closes) is Friday, and best sell day (most up closes) is Thursday.
Chart pattern: Triangle, ascending reversal pattern from 12/14/2016 to 01/09/2017
Breakout is upward 70% of the time.
Average rise: 35%.
Break-even failure rate: 13%.
Throwbacks occur 57% of the time.
Price hits measure rule target 75% of the time.
Hartford Financial Services Group Inc (HIG)
Industry: Insurance (Prop/Casualty)
Industry RS rank: 19 out of 56
Stock RS rank: 226 out of 613
1/12/17 close: $48.23
1 Month avg volatility: $0.64. Volatility stop (for upward breakout): $46.34 or 3.9% below the close.
Change YTD: 1.22%
Volume: 1,882,000 shares.
3 month avg: 2,415,637 shares.Since 2009 bear market, the best buy day (fewest up closes) is Monday, and best sell day (most up closes) is Wednesday.
Chart pattern: Rectangle top continuation pattern from 12/05/2016 to 01/12/2017
Breakout is upward 68% of the time.
Average rise: 39%.
Break-even failure rate: 9%.
Throwbacks occur 64% of the time.
Price hits measure rule target 80% of the time.
hhgregg, Inc (HGG)
Industry: Retail (Special Lines)
Industry RS rank: 25 out of 56
Stock RS rank: 612 out of 613
1/12/17 close: $0.71
1 Month avg volatility: $0.09. Volatility stop (for downward breakout): $0.93 or 31.5% above the close.
Change YTD: -50.35%
Volume: 442,900 shares.
3 month avg: 152,206 shares.Since 2009 bear market, the best buy day (fewest up closes) is Friday, and best sell day (most up closes) is Wednesday.
Chart pattern: Dead-cat bounce continuation pattern from 01/10/2017 to 01/10/2017
Breakout is downward 67% of the time.
Average decline: 18%.
Iconix Brand Group Inc. (ICON)
Industry: Shoe
Industry RS rank: 50 out of 56
Stock RS rank: 32 out of 613
1/12/17 close: $10.15
1 Month avg volatility: $0.41. Volatility stop (for upward breakout): $9.08 or 10.5% below the close.
Change YTD: 8.67%
Volume: 1,124,200 shares.
3 month avg: 680,995 shares.Since 2009 bear market, the best buy day (fewest up closes) is Friday, and best sell day (most up closes) is Monday.
Chart pattern: Rectangle top continuation pattern from 11/11/2016 to 01/12/2017
Breakout is upward 68% of the time.
Average rise: 39%.
Break-even failure rate: 9%.
Throwbacks occur 64% of the time.
Price hits measure rule target 80% of the time.
Infinera Corp. (INFN)
Industry: Telecom. Equipment
Industry RS rank: 13 out of 56
Stock RS rank: 594 out of 613
1/12/17 close: $8.70
1 Month avg volatility: $0.24. Volatility stop (for upward breakout): $8.11 or 6.8% below the close.
Change YTD: 2.47%
Volume: 1,097,100 shares.
3 month avg: 1,842,880 shares.Since 2009 bear market, the best buy day (fewest up closes) is Friday, and best sell day (most up closes) is Thursday.
Chart pattern: Triangle, symmetrical continuation pattern from 12/02/2016 to 01/12/2017
WARNING: A dead-cat bounce occurred on 07/28/2016. There is a 38% chance that a 15% or higher decline will occur (or has occurred since then) by 01/26/2017.
Breakout is upward 54% of the time.
Average rise: 31%.
Break-even failure rate: 9%.
Throwbacks occur 37% of the time.
Price hits measure rule target 66% of the time.
Insperity (NSP)
Industry: Human Resources
Industry RS rank: 18 out of 56
Stock RS rank: 513 out of 613
1/12/17 close: $70.60
1 Month avg volatility: $1.60. Volatility stop (for upward breakout): $66.90 or 5.2% below the close.
Change YTD: -0.49%
Volume: 84,600 shares.
3 month avg: 153,926 shares.Since 2009 bear market, the best buy day (fewest up closes) is Monday, and best sell day (most up closes) is Thursday.
Chart pattern: Channel from 11/10/2016 to 01/12/2017
Interactive Brokers Group Inc (IBKR)
Industry: Securities Brokerage
Industry RS rank: 1 out of 56
Stock RS rank: 286 out of 613
1/12/17 close: $38.68
1 Month avg volatility: $0.78. Volatility stop (for upward breakout): $36.87 or 4.7% below the close.
Change YTD: 5.94%
Volume: 432,900 shares.
3 month avg: 448,874 shares.Since 2009 bear market, the best buy day (fewest up closes) is Tuesday, and best sell day (most up closes) is Friday.
Chart pattern: Pipe bottom reversal pattern from 12/27/2016 to 01/03/2017
Breakout is upward 100% of the time.
Average rise: 45%.
Break-even failure rate: 5%.
Throwbacks occur 44% of the time.
Price hits measure rule target 83% of the time.
Lincoln National Corp (LNC)
Industry: Insurance (Life)
Industry RS rank: 2 out of 56
Stock RS rank: 15 out of 613
1/12/17 close: $66.54
1 Month avg volatility: $1.43. Volatility stop (for upward breakout): $62.31 or 6.4% below the close.
Change YTD: 0.41%
Volume: 948,100 shares.
3 month avg: 1,692,028 shares.Since 2009 bear market, the best buy day (fewest up closes) is Friday, and best sell day (most up closes) is Tuesday.
Chart pattern: Rectangle top continuation pattern from 12/12/2016 to 01/12/2017
Breakout is upward 68% of the time.
Average rise: 39%.
Break-even failure rate: 9%.
Throwbacks occur 64% of the time.
Price hits measure rule target 80% of the time.
Paychex Inc (PAYX)
Industry: IT Services
Industry RS rank: 35 out of 56
Stock RS rank: 376 out of 613
1/12/17 close: $61.34
1 Month avg volatility: $0.76. Volatility stop (for upward breakout): $59.19 or 3.5% below the close.
Change YTD: 0.76%
Volume: 1,070,200 shares.
3 month avg: 2,151,565 shares.Since 2009 bear market, the best buy day (fewest up closes) is Wednesday, and best sell day (most up closes) is Thursday.
Chart pattern: Triangle, symmetrical continuation pattern from 12/21/2016 to 01/11/2017
Breakout is upward 54% of the time.
Average rise: 31%.
Break-even failure rate: 9%.
Throwbacks occur 37% of the time.
Price hits measure rule target 66% of the time.
Principal Financial Group Inc (PFG)
Industry: Insurance (Diversified)
Industry RS rank: 14 out of 56
Stock RS rank: 54 out of 613
1/12/17 close: $58.87
1 Month avg volatility: $0.93. Volatility stop (for upward breakout): $56.14 or 4.6% below the close.
Change YTD: 1.75%
Volume: 1,551,500 shares.
3 month avg: 1,642,454 shares.Since 2009 bear market, the best buy day (fewest up closes) is Friday, and best sell day (most up closes) is Tuesday.
Chart pattern: Rectangle top continuation pattern from 12/16/2016 to 01/12/2017
Breakout is upward 68% of the time.
Average rise: 39%.
Break-even failure rate: 9%.
Throwbacks occur 64% of the time.
Price hits measure rule target 80% of the time.
Public Service Enterprise Group PEG (PEG)
Industry: Electric Utility (East)
Industry RS rank: 56 out of 56
Stock RS rank: 447 out of 613
1/12/17 close: $44.07
1 Month avg volatility: $0.62. Volatility stop (for upward breakout): $42.55 or 3.5% below the close.
Change YTD: 0.43%
Volume: 1,973,800 shares.
3 month avg: 2,744,722 shares.Since 2009 bear market, the best buy day (fewest up closes) is Wednesday, and best sell day (most up closes) is Thursday.
Chart pattern: Rectangle top continuation pattern from 12/16/2016 to 01/12/2017
Breakout is upward 68% of the time.
Average rise: 39%.
Break-even failure rate: 9%.
Throwbacks occur 64% of the time.
Price hits measure rule target 80% of the time.
Quaker Chemical (KWR)
Industry: Chemical (Specialty)
Industry RS rank: 16 out of 56
Stock RS rank: 59 out of 613
1/12/17 close: $128.35
1 Month avg volatility: $2.49. Volatility stop (for downward breakout): $134.72 or 5.0% above the close.
Change YTD: 0.32%
Volume: 85,000 shares.
3 month avg: 72,745 shares.This security may be thinly traded (less than 100k shares)!
Since 2009 bear market, the best buy day (fewest up closes) is Friday, and best sell day (most up closes) is Monday.
Chart pattern: Triangle, descending reversal pattern from 12/15/2016 to 01/12/2017
Breakout is downward 64% of the time.
Average decline: 16%.
Break-even failure rate: 16%.
Pullbacks occur 54% of the time.
Price hits measure rule target 54% of the time.
Scotts Miracle-Gro Co. (SMG)
Industry: Chemical (Basic)
Industry RS rank: 27 out of 56
Stock RS rank: 90 out of 613
1/12/17 close: $92.94
1 Month avg volatility: $1.40. Volatility stop (for upward breakout): $89.66 or 3.5% below the close.
Change YTD: -2.73%
Volume: 324,200 shares.
3 month avg: 567,342 shares.Since 2009 bear market, the best buy day (fewest up closes) is Monday, and best sell day (most up closes) is Friday.
Chart pattern: Rectangle top continuation pattern from 12/13/2016 to 01/09/2017
Breakout is upward 68% of the time.
Average rise: 39%.
Break-even failure rate: 9%.
Throwbacks occur 64% of the time.
Price hits measure rule target 80% of the time.
Sempra Energy (SRE)
Industry: Electric Utility (West)
Industry RS rank: 49 out of 56
Stock RS rank: 525 out of 613
1/12/17 close: $101.84
1 Month avg volatility: $1.74. Volatility stop (for upward breakout): $97.81 or 4.0% below the close.
Change YTD: 1.19%
Volume: 806,800 shares.
3 month avg: 1,283,788 shares.Since 2009 bear market, the best buy day (fewest up closes) is Wednesday, and best sell day (most up closes) is Friday.
Chart pattern: Triangle, symmetrical continuation pattern from 12/13/2016 to 01/12/2017
Breakout is upward 54% of the time.
Average rise: 31%.
Break-even failure rate: 9%.
Throwbacks occur 37% of the time.
Price hits measure rule target 66% of the time.
Stratasys Ltd (SSYS)
Industry: Electronics
Industry RS rank: 7 out of 56
Stock RS rank: 585 out of 613
1/12/17 close: $18.84
1 Month avg volatility: $0.70. Volatility stop (for upward breakout): $16.83 or 10.7% below the close.
Change YTD: 13.91%
Volume: 418,600 shares.
3 month avg: 994,612 shares.Since 2009 bear market, the best buy day (fewest up closes) is Tuesday, and best sell day (most up closes) is Monday.
Chart pattern: Pipe bottom reversal pattern from 12/27/2016 to 01/03/2017
Breakout is upward 100% of the time.
Average rise: 45%.
Break-even failure rate: 5%.
Throwbacks occur 44% of the time.
Price hits measure rule target 83% of the time.
Texas Instruments Inc. (TXN)
Industry: Semiconductor
Industry RS rank: 3 out of 56
Stock RS rank: 164 out of 613
1/12/17 close: $74.85
1 Month avg volatility: $1.00. Volatility stop (for upward breakout): $72.10 or 3.7% below the close.
Change YTD: 2.58%
Volume: 4,408,200 shares.
3 month avg: 5,203,314 shares.Since 2009 bear market, the best buy day (fewest up closes) is Monday, and best sell day (most up closes) is Thursday.
Chart pattern: Triangle, ascending reversal pattern from 11/29/2016 to 01/12/2017
Breakout is upward 70% of the time.
Average rise: 35%.
Break-even failure rate: 13%.
Throwbacks occur 57% of the time.
Price hits measure rule target 75% of the time.
United Technologies Corp (UTX)
Industry: Diversified Co.
Industry RS rank: 28 out of 56
Stock RS rank: 306 out of 613
1/12/17 close: $110.82
1 Month avg volatility: $1.19. Volatility stop (for upward breakout): $107.32 or 3.2% below the close.
Change YTD: 1.09%
Volume: 2,644,600 shares.
3 month avg: 3,362,035 shares.Since 2009 bear market, the best buy day (fewest up closes) is Monday, and best sell day (most up closes) is Thursday.
Chart pattern: Channel from 11/14/2016 to 01/11/2017
Verisign (VRSN)
Industry: Internet
Industry RS rank: 9 out of 56
Stock RS rank: 445 out of 613
1/12/17 close: $81.00
1 Month avg volatility: $1.51. Volatility stop (for upward breakout): $76.92 or 5.0% below the close.
Change YTD: 6.48%
Volume: 556,200 shares.
3 month avg: 845,032 shares.Since 2009 bear market, the best buy day (fewest up closes) is Monday, and best sell day (most up closes) is Thursday.
Chart pattern: Broadening wedge, descending reversal pattern from 11/10/2016 to 01/10/2017
Breakout is upward 79% of the time.
Average rise: 33%.
Break-even failure rate: 6%.
Throwbacks occur 53% of the time.
Price hits measure rule target 79% of the time.
YuMe Inc (YUME)
Industry: Advertising
Industry RS rank: 38 out of 56
Stock RS rank: 409 out of 613
1/12/17 close: $3.60
1 Month avg volatility: $0.14. Volatility stop (for upward breakout): $3.33 or 7.6% below the close.
Change YTD: 0.56%
Volume: 37,000 shares.
3 month avg: 65,717 shares.This security may be thinly traded (less than 100k shares)!
Since 2009 bear market, the best buy day (fewest up closes) is Thursday, and best sell day (most up closes) is Thursday.
Chart pattern: Rectangle top continuation pattern from 12/09/2016 to 01/12/2017
Breakout is upward 68% of the time.
Average rise: 39%.
Break-even failure rate: 9%.
Throwbacks occur 64% of the time.
Price hits measure rule target 80% of the time.
DJIA short 1x ProShares (DOG)
Industry: Short ETFs
Industry RS rank: 54 out of 56
Stock RS rank: 510 out of 613
1/12/17 close: $18.91
1 Month avg volatility: $0.10. Volatility stop (for downward breakout): $19.23 or 1.7% above the close.
Change YTD: -0.68%
Volume: 779,400 shares.
3 month avg: 885,914 shares.Since 2009 bear market, the best buy day (fewest up closes) is Friday, and best sell day (most up closes) is Monday.
Chart pattern: Rectangle bottom continuation pattern from 12/13/2016 to 01/12/2017
Breakout is downward 55% of the time.
Average decline: 14%.
Break-even failure rate: 16%.
Pullbacks occur 69% of the time.
Price hits measure rule target 50% of the time.
DJIA short 2x ProShares (DXD)
Industry: Short ETFs
Industry RS rank: 54 out of 56
Stock RS rank: 573 out of 613
1/12/17 close: $14.00
1 Month avg volatility: $0.15. Volatility stop (for downward breakout): $14.48 or 3.4% above the close.
Change YTD: -1.27%
Volume: 1,297,500 shares.
3 month avg: 1,298,454 shares.Since 2009 bear market, the best buy day (fewest up closes) is Friday, and best sell day (most up closes) is Monday.
Chart pattern: Rectangle bottom continuation pattern from 12/13/2016 to 01/12/2017
Breakout is downward 55% of the time.
Average decline: 14%.
Break-even failure rate: 16%.
Pullbacks occur 69% of the time.
Price hits measure rule target 50% of the time.
iShares DJ US Regional Banks (IAT)
Industry: Long ETFs
Industry RS rank: 29 out of 56
Stock RS rank: 53 out of 613
1/12/17 close: $45.27
1 Month avg volatility: $0.63. Volatility stop (for upward breakout): $43.54 or 3.8% below the close.
Change YTD: -0.24%
Volume: 210,600 shares.
3 month avg: 287,972 shares.Since 2009 bear market, the best buy day (fewest up closes) is Monday, and best sell day (most up closes) is Wednesday.
Chart pattern: Rectangle top continuation pattern from 12/08/2016 to 01/12/2017
Breakout is upward 68% of the time.
Average rise: 39%.
Break-even failure rate: 9%.
Throwbacks occur 64% of the time.
Price hits measure rule target 80% of the time.
S and P Latin America 40 Index fund (ILF)
Industry: Investment Co. (Foreign)
Industry RS rank: 32 out of 56
Stock RS rank: 259 out of 613
1/12/17 close: $29.33
1 Month avg volatility: $0.40. Volatility stop (for upward breakout): $28.41 or 3.1% below the close.
Change YTD: 6.35%
Volume: 1,146,600 shares.
3 month avg: 1,974,643 shares.Since 2009 bear market, the best buy day (fewest up closes) is Monday, and best sell day (most up closes) is Friday.
Chart pattern: Broadening bottom reversal pattern from 11/22/2016 to 01/10/2017
Breakout is upward 53% of the time.
Average rise: 27%.
Break-even failure rate: 10%.
Throwbacks occur 41% of the time.
Price hits measure rule target 59% of the time.
Thursday 1/12/17. Intraday Market Direction: Nasdaq
Average gain was 0.8% on 370 occasions.
Average loss was -0.8% on 269 occasions.
Expect the index to close higher 57.9% of the time.
Weekly, since inception on 6/14/2011:
The prediction of the index closing higher has been right 120/207 or 58.0% of the time.
The prediction of the index closing lower has been right 41/80 or 51.2% of the time.
Since I post this the night before, check how the futures are trading before market open. Large moves can affect the opening direction.

$ $ $
I show a picture of the Nasdaq composite on the 5-minute scale.
The chart shows two lines. Let’s talk about the red one first.
I started drawing the line (A) from the lowest price on the chart, connecting the minor lows. Notice that recent price action has
pierced the line, near B.
Now, it looks as if the index is pulling back to the trendline. If you look closely, you’ll see that the index
dropped to form a double bottom (C), completing the pullback during the drop from B to C.
The index has recovered and formed a valid double bottom, confirmed when the index closed above the peak between the two bottoms.
Now, the index is hitting overhead resistance setup by the prior two peaks. I show that resistance with a magenta line. I guess it’s probably cyan in color.
But it looks like a triple top. That will only become a valid pattern when the index closes below the lowest valley between the three peaks.
That hasn’t happened yet, of course.
$ $ $
The following table shows where Fibonacci retrace values of the day’s high-low range are plus pivot points, calculated on the Nasdaq composite, sorted by value. When several are near each other (small differences),
the area might act as support or resistance.
— Thomas Bulkowski
| © 2017 ThePatternSite.com Metric | Value | Diff | Close (within 10% of the high-low range for the day)? |
| Monthly S2 | 5,149.23 | ||
| Monthly S1 | 5,356.44 | 207.21 | |
| Weekly S2 | 5,360.86 | 4.42 | |
| Monthly Pivot | 5,446.48 | 85.62 | |
| Weekly S1 | 5,462.25 | 15.77 | |
| Weekly Pivot | 5,499.39 | 37.13 | |
| Daily S2 | 5,510.54 | 11.15 | |
| Low | 5,524.03 | 13.49 | |
| Daily S1 | 5,537.09 | 13.06 | |
| 61.8% Down from Intraday High | 5,539.33 | 2.24 | Yes! The 61.8% Down from Intraday High is close to the Daily S1. |
| 50% Down from Intraday High | 5,544.06 | 4.73 | |
| 38.2% Down from Intraday High | 5,548.78 | 4.73 | |
| Daily Pivot | 5,550.59 | 1.81 | Yes! The Daily Pivot is close to the 38.2% Down from Intraday High. |
| Open | 5,550.72 | 0.13 | Yes! The Open is close to the Daily Pivot. |
| Close | 5,563.65 | 12.93 | |
| High | 5,564.08 | 0.43 | Yes! The High is close to the Close. |
| Daily R1 | 5,577.14 | 13.06 | |
| Daily R2 | 5,590.64 | 13.49 | |
| Weekly R1 | 5,600.78 | 10.15 | |
| Weekly R2 | 5,637.92 | 37.13 | |
| Monthly R1 | 5,653.69 | 15.77 | |
| Monthly R2 | 5,743.73 | 90.04 |
Wednesday 1/11/17. A Look At Indicators

This is a picture of the chart pattern indicator on the daily scale. The indicator is the line chart below a chart of the S&P 500 composite.
The chart shows weakness, denoted by the red vertical bar on the far right. It’s a bearish signal.
Don’t panic. Okay, panic for a bit, but then come back to earth. ![]()
Signals can appear or disappear for a week, so we won’t know if the indicator is serious until next week.
I think it’s possible that the index will move sideways to down for a while, making the move proportional to the fast, November 2016 climb. And with earnings season starting, look out.

The red line is the percentage of stocks at least 20% below their 1-year high (plotted upside down). The blue line is the average percentage drop of stocks below their 1-year high (plotted upside down).
On Monday, 16% of stocks in my database are in bear market territory (down at least 20% from their 1-year high).
A week ago, it was 19%.
The fewest was 14% on 12/09/2016.
And the most was 69% on 02/11/2016.
The 518 stocks in my database are down an average of 12% from their yearly high.
A week ago, the average was 12%.
The peak was 10% on 12/09/2016.
And the bottom was 32% on 02/11/2016.
The past week showed that the market regained strength. The red line moved up three percentage points, from 19% bearish to 16%. You can see the quick move higher on the chart.
The blue like is more sedate. Over the past week, it’s been flat.
The CPI chart shows a bearish signal. The red line in this chart is bullish. Which chart do I believe?
I suppose both charts can be right, depending on how far you look into the future. I’m fond of the CPI chart. The red and blue lines, with those, I’m not sure what to make of them yet.
I still think the market is weak and I’ve been selling a few positions to capture profits in the new year.
— Thomas Bulkowski
Tuesday 1/10/17. New Book Released: Head’s Law
I released my first novel (fiction): Head’s Law!
I show a copy of that new book on the lower right. Links below the image will take you to Amazon where you can buy either the kindle e-book ($3.99) or the paperback ($9.99).
I decided to self publish this book not to make money (I’m making $1.40 on the e-book, and ~$2.00 on the paperback), but as a birthday present for my mom. She in her mid 80s, and I thought
it would be a nice gift. It’s dedicated to her, too.
Here’s what the back cover says:
|
When you self publish, you’ll sell about 200 copies, mostly to friends and family. That’s about break even for me (I hired a friend to help with publication).
Harry Potter author J.K. Rowling sold just 1,200 copies of her post-potter book (I don’t recall the title, but it received good reviews) when she published it under a pen name.
That is, until someone figured out she wrote it. Then sales ballooned.
So please take a look by clicking on one of the associated links. There’s a nook version coming but paperwork is hold up publication.
Thanks! — Tom
Tuesday 1/10/17. Intraday Market Direction: Dow
Average gain was 0.7% on 449 occasions.
Average loss was -0.6% on 436 occasions.
Expect the index to close higher 50.7% of the time.
Weekly, since inception on 6/14/2011:
The prediction of the index closing higher has been right 130/216 or 60.2% of the time.
The prediction of the index closing lower has been right 32/64 or 50.0% of the time.
Since I post this the night before, check how the futures are trading before market open. Large moves can affect the opening direction.

$ $ $
I show a picture of the Dow industrials on the 5-minute scale.
I drew the red trendline connecting the bottom of the index. This trendline follows the 1-2-3 trend change method outlined by Victor Sperandeo.
You start from the lowest price on the chart and draw a line to the highest peak so that the line doesn’t cross any prices until after the peak. The lowest low on the chart is where
the red line begins and the peak is at the Head. Draw a line to connect those two points (thin blue line) and swing the line downward from the Head (green arrow) until the line does not
cross price until after the peak.
Anyway, it shows that the index has dropped below the trendline. That, of course, does not mean a trend change from up to down.
I also show a head-and-shoulders top chart pattern. It confirms as a valid pattern when the index closes below the neckline. You can use the red line as the
neckline in this example.
The above probabilities suggest a higher close on Tuesday but this chart looks weak to me. The index might open lower but then rebound to close higher. My guess is it’ll go down and stay down
for the count.
$ $ $
The following table shows where Fibonacci retrace values of the day’s high-low range are plus pivot points, calculated on the Dow industrials, sorted by value. When several are near each other (small differences),
the area might act as support or resistance.
— Thomas Bulkowski
| © 2017 ThePatternSite.com Metric | Value | Diff | Close (within 10% of the high-low range for the day)? |
| Monthly S2 | 18,817.61 | ||
| Monthly S1 | 19,352.50 | 534.88 | |
| Weekly S2 | 19,663.95 | 311.45 | |
| Monthly Pivot | 19,676.06 | 12.12 | |
| Weekly S1 | 19,775.66 | 99.60 | |
| Daily S2 | 19,849.78 | 74.12 | |
| Daily S1 | 19,868.58 | 18.80 | |
| Close | 19,887.38 | 18.80 | |
| Low | 19,887.38 | 0.00 | Yes! The Low is close to the Close. |
| Weekly Pivot | 19,887.65 | 0.27 | Yes! The Weekly Pivot is close to the Low. |
| Daily Pivot | 19,906.18 | 18.53 | |
| 61.8% Down from Intraday High | 19,908.92 | 2.74 | Yes! The 61.8% Down from Intraday High is close to the Daily Pivot. |
| 50% Down from Intraday High | 19,915.58 | 6.66 | |
| 38.2% Down from Intraday High | 19,922.23 | 6.65 | |
| Daily R1 | 19,924.98 | 2.75 | Yes! The Daily R1 is close to the 38.2% Down from Intraday High. |
| Open | 19,931.41 | 6.43 | |
| High | 19,943.78 | 12.37 | |
| Daily R2 | 19,962.58 | 18.80 | |
| Weekly R1 | 19,999.36 | 36.78 | |
| Weekly R2 | 20,111.35 | 111.98 | |
| Monthly R1 | 20,210.95 | 99.60 | |
| Monthly R2 | 20,534.51 | 323.57 |
Monday 1/9/17. Market Monday: The Week Ahead
My Prediction

I show a picture of the Nasdaq composite on the daily scale.
The index made it to a new high (A), so I switched my target (“Tom’s Targets,” top of page) to up and adjusted the numbers.
My feeling is that the index will coast higher, round over, and drop back to about where it is now.
How long it’ll take to do that is unknown, but it could make the trip by mid month. My guess is that it’ll take a big longer.
Protecting the move on the upside is a trendline, B. I drew the one on the bottom first, then decided to add the top one.
These two act as an upward sloping channel. I’m thinking that the index will remain longer in the channel, but eventually break out of it going sideways.
It looks as if we have another day or two of “up” move before it touches the top of the channel and drops.
A Brief Look Back

The following is a brief review of how the markets performed over time. The numbers refer to the close-to-close move in the Dow industrials.
Tuesday: Up 119.16 points.
Wednesday: Up 60.4 points.
Thursday: Down 42.87 points.
Friday: Up 64.51 points.
Saturday: Holiday or other weird event!
For the Week…
The Dow industrials were up 201.2 points or 1.0%.
The Nasdaq composite was up 137.94 points or 2.6%.
The S&P 500 index was up 38.1499 points or 1.7%.
Year to Date…
Dow Industrials
0.2% down from the high of 19,999.63 on 01/06/2017.
0.9% up from the low of 19,775.93 on 01/03/2017.
Nasdaq
0.3% down from the high of 5,536.52 on 01/06/2017.
2.3% up from the low of 5,397.99 on 01/03/2017.
S&P 500
0.2% down from the high of 2,282.10 on 01/06/2017.
1.4% up from the low of 2,245.13 on 01/03/2017.
Options Expiration
No options expire this week.
Swing and Position Traders: Chart Pattern Indicator
As of 01/06/2017, the CPI had:
5 bearish patterns,
11 bullish patterns,
161 patterns waiting for breakout.
The CPI signal is 68.8%, which is
bullish (>= 65%).
The chart pattern indicator is bullish
with 1 of 3 half triangles showing ( ). Additional triangles are a measure
of strength with solid triangles meaning a more reliable signal than half triangles.
Swing Traders: Pivot Points
The following is based on an SFO article in December 2004 by John Seekinger, titled, “Take a
two-dimensional approach.” He offers these tips.
| Index | S2 | S1 | Pivot | R1 | R2 |
| Dow Industrials (^DJI): Daily | 19,767 | 19,865 | 19,933 | 20,031 | 20,098 |
| Weekly | 19,689 | 19,827 | 19,913 | 20,050 | 20,137 |
| Monthly | 18,843 | 19,403 | 19,702 | 20,262 | 20,560 |
| S&P500 (^GSPC): Daily | 2,256 | 2,267 | 2,274 | 2,285 | 2,292 |
| Weekly | 2,231 | 2,254 | 2,268 | 2,291 | 2,305 |
| Monthly | 2,155 | 2,216 | 2,249 | 2,310 | 2,343 |
| Nasdaq (^IXIC): Daily | 5,460 | 5,490 | 5,513 | 5,544 | 5,567 |
| Weekly | 5,347 | 5,434 | 5,485 | 5,572 | 5,624 |
| Monthly | 5,135 | 5,328 | 5,432 | 5,625 | 5,730 |
- Seekinger doesn’t look at the range of S2 to R2 as support and resistance levels. Rather, he considers them oversold (S) and overbought (R) areas.
- S2 to R2 range of values across daily, weekly, and monthly periods: If two values are close together then they lend more significance to the area.
- If the market trends on day 1, the odds rise tremendously that the market will be range bound between daily S1 and daily R1 the next day.
- In a quiet market when traders are waiting for an important earnings announcement or economic report, look for daily R1 and S1 levels to hold and for the market to return to the daily pivot.
- A move outside of daily R1 or S1 usually does not mean a breakout.
- The odds suggest that the entire week’s price action will remain between weekly R2 and S2.
- Avoid going long when the market moves above weekly R2 (it’s overbought) and avoid going short when price moves below weekly S2 (oversold).
- Consider going short at weekly R1 or long at weekly S1 with a profit objective of the weekly pivot.
- Consider going long at weekly S2 or short at weekly R2 with a profit objective of weekly S1 or R1, respectively.
Here are the formulas:
Pivot point: P = (H + L + C)/3
First resistance level: R1 = (2 * P) – L
First support level: S1 = (2 * P) – H)
Second resistance level: R2 = P + (R1 – S1)
Second support level: S2 = P – (R1 – S1)
H = high price , L=low price, C=closing price
Consecutive Price Trends
| Index | Consecutive Closes So Far |
% | Comments |
| Dow industrials (^DJI) | 1 week up | 42.8% | Expect a random direction. |
| 3 months up | 29.9% | The trend may continue. | |
| S & P 500 (^GSPC) | 1 week up | 42.3% | Expect a random direction. |
| 3 months up | 36.9% | The trend may continue. | |
| Nasdaq composite (^IXIC) | 1 week up | 44.9% | Expect a random direction. |
| 3 months up | 28.2% | The trend may continue. |
How long can an index close higher (or lower) each day? The adjacent table shows how often consecutive up or down closes occur in the indices, based on the most recent trend of closes.
Low percentages suggest the market is overdue to turn (think of it as the likelihood that next week or next month will continue the trend, based on historical performance). Values of 50% mean random, so most percentages will be lower.
The analysis uses data going back 10 years for weekly percentages and 25 years for monthly percentages (or the start of data, whichever is more recent). Any unchanged closing price is interpreted as the end of the string of consecutive up or down closes.
Earnings, Chart Patterns & Industries
Earnings season will be starting in about 7 days.
| Found | Chart Pattern Name |
| 28 | Triangle, symmetrical |
| 11 | Pipe top |
| 8 | Double Top, Adam and Adam |
| 8 | Flag, high and tight |
| 6 | Head-and-shoulders top |
| 4 | Rectangle top |
| 4 | Rising wedge |
| 4 | Triangle, ascending |
| 4 | Triple top |
| 3 | Pipe bottom |
Large numbers of bullish or bearish chart patterns can signal short- to intermediate-term market trends (many bullish chart patterns can mean an uptrend will continue, for example).
However, please realize that the short-term price trend could have changed since the pattern was discovered (this is especially true of pipe tops or bottoms, which are weekly patterns).
The 10 types of most frequently appearing chart patterns in the stocks, indices, and long-only exchange traded funds I follow during the last month are shown in the adjacent table.
The industries I follow were the best (rank 1) and worst performing.
Note: Something went wrong with my computer (probably because of taking off Monday) and it shows a duplicate of the prior week in the following table.
|
— Thomas Bulkowski
Friday 1/6/17. Pattern Trading Setups for the Weekend.
Go to Table.
You can find setups based on a Fibonacci retrace by clicking on the link.
Click the link for a list of symbols from the table.
The following patterns were found manually, so the results may differ from those found using Patternz.
There were 20 patterns found this week (excluding pipe bottoms; pipe tops and bottoms are found looking back 2 weeks) out of 621 stocks searched, or 3.2%. Based on the percentage, the stock market is
trending since few consolidation patterns appear.
I found 1 pipe bottom chart patterns, which is neutral. High numbers of pipe bottoms can signal a bullish move (I see many of them just before a bear market ends or during a bear market rally. Often it means the first bottom of a double bottom has formed. Thus, expect a move down to the second bottom).
Excluding ETFs, there were 13 bullish chart patterns this week and 3 bearish ones with any remaining (1) being undecided.
The ratio of bullish to bearish patterns suggests the market is hinting of a coming bullish (up) turn.
In the table below, the red and green colors are based on the historical breakout direction for the associated chart pattern. If a high and tight flag appears, the start and end dates highlight the flagpole only and not the flag.
More…
— Thomas Bulkowski
| Symbol | Chart Pattern | Bullish Bearish |
Start | End | Industry |
| AXE | Triangle, ascending | 12/02/2016 | 01/05/2017 | Electronics | |
| BSET | Triangle, symmetrical | 12/09/2016 | 01/05/2017 | Furn/Home Furnishings | |
| CTSH | Triangle, symmetrical | 12/07/2016 | 01/03/2017 | IT Services | |
| CVG | Triangle, descending | 11/29/2016 | 12/30/2016 | Computer Software and Svcs | |
| EL | Triangle, symmetrical | 12/01/2016 | 01/03/2017 | Toiletries/Cosmetics | |
| FFG | Falling wedge | 12/12/2016 | 01/03/2017 | Insurance (Life) | |
| FLIR | Triangle, symmetrical | 12/09/2016 | 01/05/2017 | Aerospace/Defense | |
| GME | Falling wedge | 12/13/2016 | 01/05/2017 | Retail (Special Lines) | |
| HNI | Rising wedge | 11/28/2016 | 12/30/2016 | Furn/Home Furnishings | |
| ICON | Rectangle top | 11/11/2016 | 01/05/2017 | Shoe | |
| K | Triangle, symmetrical | 11/22/2016 | 01/04/2017 | Food Processing | |
| KELYA | Triangle, symmetrical | 12/19/2016 | 01/05/2017 | Human Resources | |
| KSS | Dead-cat bounce | 01/05/2017 | 01/05/2017 | Retail Store | |
| MS | Rectangle top | 12/13/2016 | 01/05/2017 | Securities Brokerage | |
| SYMC | Triangle, symmetrical | 11/21/2016 | 01/05/2017 | Computer Software and Svcs | |
| TRV | Double Top, Adam and Adam | 12/21/2016 | 01/03/2017 | Insurance (Prop/Casualty) | |
| YUME | Rectangle top | 12/09/2016 | 01/05/2017 | Advertising | |
| DOG | Rectangle bottom | 12/13/2016 | 01/05/2017 | Short ETFs | |
| DXD | Rectangle bottom | 12/13/2016 | 01/05/2017 | Short ETFs | |
| FXI | Pipe bottom | 12/19/2016 | 12/27/2016 | Investment Co. (Foreign) | |
| IAT | Rectangle top | 12/08/2016 | 01/05/2017 | Long ETFs |
Weekly screen for chart patterns ending between 12/29/2016 and 01/05/2017. Many may be still in development. If no securities appear, then I have not identified any new patterns.
Definitions
’Breakout is upward/downward 100% of the time’ means price breaks out up/down by definition, not by statistically measuring the rate.
All numbers assume a bull market and are based on the breakout direction that occurs most often.
Anixter International Inc (AXE)
Industry: Electronics
Industry RS rank: 7 out of 56
Stock RS rank: 31 out of 613
1/5/17 close: $82.20
1 Month avg volatility: $2.01. Volatility stop (for upward breakout): $77.33 or 5.9% below the close.
Change YTD: 1.42%
Volume: 68,000 shares.
3 month avg: 159,032 shares.Since 2009 bear market, the best buy day (fewest up closes) is Monday, and best sell day (most up closes) is Tuesday.
Chart pattern: Triangle, ascending reversal pattern from 12/02/2016 to 01/05/2017
Breakout is upward 70% of the time.
Average rise: 35%.
Break-even failure rate: 13%.
Throwbacks occur 57% of the time.
Price hits measure rule target 75% of the time.
Bassett Furniture Industries Inc (BSET)
Industry: Furn/Home Furnishings
Industry RS rank: 37 out of 56
Stock RS rank: 164 out of 613
1/5/17 close: $30.25
1 Month avg volatility: $0.96. Volatility stop (for upward breakout): $28.08 or 7.2% below the close.
Change YTD: -0.49%
Volume: 16,800 shares.
3 month avg: 29,972 shares.This security may be thinly traded (less than 100k shares)!
Since 2009 bear market, the best buy day (fewest up closes) is Monday, and best sell day (most up closes) is Tuesday.
Chart pattern: Triangle, symmetrical continuation pattern from 12/09/2016 to 01/05/2017
Breakout is upward 54% of the time.
Average rise: 31%.
Break-even failure rate: 9%.
Throwbacks occur 37% of the time.
Price hits measure rule target 66% of the time.
Cognizant Technology Solutions Corp (CTSH)
Industry: IT Services
Industry RS rank: 35 out of 56
Stock RS rank: 416 out of 613
1/5/17 close: $57.09
1 Month avg volatility: $0.93. Volatility stop (for upward breakout): $55.12 or 3.5% below the close.
Change YTD: 1.89%
Volume: 5,152,400 shares.
3 month avg: 7,173,946 shares.Since 2009 bear market, the best buy day (fewest up closes) is Monday, and best sell day (most up closes) is Tuesday.
Chart pattern: Triangle, symmetrical continuation pattern from 12/07/2016 to 01/03/2017
Breakout is upward 54% of the time.
Average rise: 31%.
Break-even failure rate: 9%.
Throwbacks occur 37% of the time.
Price hits measure rule target 66% of the time.
Convergys Corporation (CVG)
Industry: Computer Software and Svcs
Industry RS rank: 23 out of 56
Stock RS rank: 398 out of 613
1/5/17 close: $25.58
1 Month avg volatility: $0.57. Volatility stop (for downward breakout): $26.76 or 4.6% above the close.
Change YTD: 4.15%
Volume: 642,900 shares.
3 month avg: 672,269 shares.Since 2009 bear market, the best buy day (fewest up closes) is Monday, and best sell day (most up closes) is Thursday.
Chart pattern: Triangle, descending reversal pattern from 11/29/2016 to 12/30/2016
Breakout is downward 64% of the time.
Average decline: 16%.
Break-even failure rate: 16%.
Pullbacks occur 54% of the time.
Price hits measure rule target 54% of the time.
Estee Lauder, Cos (EL)
Industry: Toiletries/Cosmetics
Industry RS rank: 53 out of 56
Stock RS rank: 572 out of 613
1/5/17 close: $78.60
1 Month avg volatility: $1.14. Volatility stop (for upward breakout): $75.29 or 4.2% below the close.
Change YTD: 2.76%
Volume: 1,505,000 shares.
3 month avg: 1,935,014 shares.Since 2009 bear market, the best buy day (fewest up closes) is Monday, and best sell day (most up closes) is Thursday.
Chart pattern: Triangle, symmetrical continuation pattern from 12/01/2016 to 01/03/2017
Breakout is upward 54% of the time.
Average rise: 31%.
Break-even failure rate: 9%.
Throwbacks occur 37% of the time.
Price hits measure rule target 66% of the time.
FBL Financial Group (FFG)
Industry: Insurance (Life)
Industry RS rank: 2 out of 56
Stock RS rank: 107 out of 613
1/5/17 close: $76.35
1 Month avg volatility: $1.62. Volatility stop (for upward breakout): $72.96 or 4.4% below the close.
Change YTD: -2.30%
Volume: 12,500 shares.
3 month avg: 28,165 shares.This security may be thinly traded (less than 100k shares)!
Since 2009 bear market, the best buy day (fewest up closes) is Wednesday, and best sell day (most up closes) is Thursday.
Chart pattern: Falling wedge from 12/12/2016 to 01/03/2017
Breakout is upward 68% of the time.
Average rise: 32%.
Break-even failure rate: 11%.
Throwbacks occur 56% of the time.
Price hits measure rule target 70% of the time.
Flir Systems Inc (FLIR)
Industry: Aerospace/Defense
Industry RS rank: 24 out of 56
Stock RS rank: 218 out of 613
1/5/17 close: $36.41
1 Month avg volatility: $0.55. Volatility stop (for upward breakout): $35.15 or 3.5% below the close.
Change YTD: 0.61%
Volume: 807,600 shares.
3 month avg: 728,797 shares.Since 2009 bear market, the best buy day (fewest up closes) is Monday, and best sell day (most up closes) is Thursday.
Chart pattern: Triangle, symmetrical continuation pattern from 12/09/2016 to 01/05/2017
Breakout is upward 54% of the time.
Average rise: 31%.
Break-even failure rate: 9%.
Throwbacks occur 37% of the time.
Price hits measure rule target 66% of the time.
GameStop Corp (GME)
Industry: Retail (Special Lines)
Industry RS rank: 20 out of 56
Stock RS rank: 491 out of 613
1/5/17 close: $25.00
1 Month avg volatility: $0.64. Volatility stop (for upward breakout): $23.61 or 5.6% below the close.
Change YTD: -1.03%
Volume: 3,028,100 shares.
3 month avg: 2,631,375 shares.Since 2009 bear market, the best buy day (fewest up closes) is Friday, and best sell day (most up closes) is Monday.
Chart pattern: Falling wedge from 12/13/2016 to 01/05/2017
Breakout is upward 68% of the time.
Average rise: 32%.
Break-even failure rate: 11%.
Throwbacks occur 56% of the time.
Price hits measure rule target 70% of the time.
HNI (HON Industries) (HNI)
Industry: Furn/Home Furnishings
Industry RS rank: 37 out of 56
Stock RS rank: 249 out of 613
1/5/17 close: $53.10
1 Month avg volatility: $1.35. Volatility stop (for downward breakout): $58.18 or 9.6% above the close.
Change YTD: -5.04%
Volume: 278,300 shares.
3 month avg: 223,302 shares.Since 2009 bear market, the best buy day (fewest up closes) is Friday, and best sell day (most up closes) is Thursday.
Chart pattern: Rising wedge reversal pattern from 11/28/2016 to 12/30/2016
WARNING: A dead-cat bounce occurred on 09/20/2016. There is a 38% chance that a 15% or higher decline will occur (or has occurred since then) by 03/21/2017.
Breakout is downward 69% of the time.
Average decline: 14%.
Break-even failure rate: 24%.
Pullbacks occur 63% of the time.
Price hits measure rule target 46% of the time.
Iconix Brand Group Inc. (ICON)
Industry: Shoe
Industry RS rank: 40 out of 56
Stock RS rank: 52 out of 613
1/5/17 close: $9.47
1 Month avg volatility: $0.40. Volatility stop (for upward breakout): $8.48 or 10.5% below the close.
Change YTD: 1.39%
Volume: 605,500 shares.
3 month avg: 653,997 shares.Since 2009 bear market, the best buy day (fewest up closes) is Friday, and best sell day (most up closes) is Monday.
Chart pattern: Rectangle top continuation pattern from 11/11/2016 to 01/05/2017
Breakout is upward 68% of the time.
Average rise: 39%.
Break-even failure rate: 9%.
Throwbacks occur 64% of the time.
Price hits measure rule target 80% of the time.
Kellogg Co (K)
Industry: Food Processing
Industry RS rank: 42 out of 56
Stock RS rank: 553 out of 613
1/5/17 close: $73.11
1 Month avg volatility: $0.93. Volatility stop (for upward breakout): $70.50 or 3.6% below the close.
Change YTD: -0.81%
Volume: 1,316,900 shares.
3 month avg: 1,616,532 shares.Since 2009 bear market, the best buy day (fewest up closes) is Wednesday, and best sell day (most up closes) is Friday.
Chart pattern: Triangle, symmetrical continuation pattern from 11/22/2016 to 01/04/2017
Breakout is upward 54% of the time.
Average rise: 31%.
Break-even failure rate: 9%.
Throwbacks occur 37% of the time.
Price hits measure rule target 66% of the time.
Kelly Services A (KELYA)
Industry: Human Resources
Industry RS rank: 16 out of 56
Stock RS rank: 193 out of 613
1/5/17 close: $22.78
1 Month avg volatility: $0.54. Volatility stop (for upward breakout): $21.69 or 4.8% below the close.
Change YTD: -0.61%
Volume: 44,500 shares.
3 month avg: 107,420 shares.Since 2009 bear market, the best buy day (fewest up closes) is Monday, and best sell day (most up closes) is Tuesday.
Chart pattern: Triangle, symmetrical continuation pattern from 12/19/2016 to 01/05/2017
Breakout is upward 54% of the time.
Average rise: 31%.
Break-even failure rate: 9%.
Throwbacks occur 37% of the time.
Price hits measure rule target 66% of the time.
Kohls Corporation (KSS)
Industry: Retail Store
Industry RS rank: 43 out of 56
Stock RS rank: 267 out of 613
1/5/17 close: $42.01
1 Month avg volatility: $2.15. Volatility stop (for downward breakout): $56.18 or 33.7% above the close.
Change YTD: -14.93%
Volume: 26,811,900 shares.
3 month avg: 4,309,958 shares.Since 2009 bear market, the best buy day (fewest up closes) is Monday, and best sell day (most up closes) is Thursday.
Chart pattern: Dead-cat bounce continuation pattern from 01/05/2017 to 01/05/2017
Breakout is downward 67% of the time.
Average decline: 18%.
Morgan Stanley (MS)
Industry: Securities Brokerage
Industry RS rank: 1 out of 56
Stock RS rank: 18 out of 613
1/5/17 close: $43.22
1 Month avg volatility: $0.83. Volatility stop (for upward breakout): $40.53 or 6.2% below the close.
Change YTD: 2.30%
Volume: 9,784,100 shares.
3 month avg: 12,266,754 shares.Since 2009 bear market, the best buy day (fewest up closes) is Monday, and best sell day (most up closes) is Friday.
Chart pattern: Rectangle top continuation pattern from 12/13/2016 to 01/05/2017
Breakout is upward 68% of the time.
Average rise: 39%.
Break-even failure rate: 9%.
Throwbacks occur 64% of the time.
Price hits measure rule target 80% of the time.
Symantec Corp (SYMC)
Industry: Computer Software and Svcs
Industry RS rank: 23 out of 56
Stock RS rank: 179 out of 613
1/5/17 close: $24.65
1 Month avg volatility: $0.43. Volatility stop (for upward breakout): $23.28 or 5.6% below the close.
Change YTD: 3.18%
Volume: 7,463,200 shares.
3 month avg: 8,351,063 shares.Since 2009 bear market, the best buy day (fewest up closes) is Friday, and best sell day (most up closes) is Thursday.
Chart pattern: Triangle, symmetrical continuation pattern from 11/21/2016 to 01/05/2017
Breakout is upward 54% of the time.
Average rise: 31%.
Break-even failure rate: 9%.
Throwbacks occur 37% of the time.
Price hits measure rule target 66% of the time.
Travelers Companies Inc, The (TRV)
Industry: Insurance (Prop/Casualty)
Industry RS rank: 22 out of 56
Stock RS rank: 427 out of 613
1/5/17 close: $118.33
1 Month avg volatility: $1.30. Volatility stop (for downward breakout): $122.11 or 3.2% above the close.
Change YTD: -3.34%
Volume: 2,688,000 shares.
3 month avg: 1,894,072 shares.Since 2009 bear market, the best buy day (fewest up closes) is Tuesday, and best sell day (most up closes) is Thursday.
Chart pattern: Double Top, Adam and Adam reversal pattern from 12/21/2016 to 01/03/2017
Breakout is downward 100% of the time.
Average decline: 19%.
Break-even failure rate: 8%.
Pullbacks occur 61% of the time.
Price hits measure rule target 72% of the time.
YuMe Inc (YUME)
Industry: Advertising
Industry RS rank: 39 out of 56
Stock RS rank: 464 out of 613
1/5/17 close: $3.56
1 Month avg volatility: $0.14. Volatility stop (for upward breakout): $3.26 or 8.4% below the close.
Change YTD: -0.56%
Volume: 31,500 shares.
3 month avg: 67,508 shares.This security may be thinly traded (less than 100k shares)!
Since 2009 bear market, the best buy day (fewest up closes) is Thursday, and best sell day (most up closes) is Thursday.
Chart pattern: Rectangle top continuation pattern from 12/09/2016 to 01/05/2017
Breakout is upward 68% of the time.
Average rise: 39%.
Break-even failure rate: 9%.
Throwbacks occur 64% of the time.
Price hits measure rule target 80% of the time.
DJIA short 1x ProShares (DOG)
Industry: Short ETFs
Industry RS rank: 56 out of 56
Stock RS rank: 556 out of 613
1/5/17 close: $18.91
1 Month avg volatility: $0.11. Volatility stop (for downward breakout): $19.21 or 1.6% above the close.
Change YTD: -0.68%
Volume: 495,200 shares.
3 month avg: 877,709 shares.Since 2009 bear market, the best buy day (fewest up closes) is Thursday, and best sell day (most up closes) is Monday.
Chart pattern: Rectangle bottom continuation pattern from 12/13/2016 to 01/05/2017
Breakout is downward 55% of the time.
Average decline: 14%.
Break-even failure rate: 16%.
Pullbacks occur 69% of the time.
Price hits measure rule target 50% of the time.
DJIA short 2x ProShares (DXD)
Industry: Short ETFs
Industry RS rank: 56 out of 56
Stock RS rank: 598 out of 613
1/5/17 close: $13.99
1 Month avg volatility: $0.16. Volatility stop (for downward breakout): $14.46 or 3.4% above the close.
Change YTD: -1.34%
Volume: 1,078,000 shares.
3 month avg: 1,320,897 shares.Since 2009 bear market, the best buy day (fewest up closes) is Friday, and best sell day (most up closes) is Monday.
Chart pattern: Rectangle bottom continuation pattern from 12/13/2016 to 01/05/2017
Breakout is downward 55% of the time.
Average decline: 14%.
Break-even failure rate: 16%.
Pullbacks occur 69% of the time.
Price hits measure rule target 50% of the time.
FTSE/Xinhua China 25 index fund (FXI)
Industry: Investment Co. (Foreign)
Industry RS rank: 27 out of 56
Stock RS rank: 322 out of 613
1/5/17 close: $36.02
1 Month avg volatility: $0.30. Volatility stop (for upward breakout): $35.28 or 2.1% below the close.
Change YTD: 3.77%
Volume: 23,946,100 shares.
3 month avg: 19,269,394 shares.Since 2009 bear market, the best buy day (fewest up closes) is Monday, and best sell day (most up closes) is Tuesday.
Chart pattern: Pipe bottom reversal pattern from 12/19/2016 to 12/27/2016
Breakout is upward 100% of the time.
Average rise: 45%.
Break-even failure rate: 5%.
Throwbacks occur 44% of the time.
Price hits measure rule target 83% of the time.
iShares DJ US Regional Banks (IAT)
Industry: Long ETFs
Industry RS rank: 29 out of 56
Stock RS rank: 57 out of 613
1/5/17 close: $45.29
1 Month avg volatility: $0.64. Volatility stop (for upward breakout): $43.73 or 3.5% below the close.
Change YTD: -0.20%
Volume: 394,800 shares.
3 month avg: 266,532 shares.Since 2009 bear market, the best buy day (fewest up closes) is Monday, and best sell day (most up closes) is Wednesday.
Chart pattern: Rectangle top continuation pattern from 12/08/2016 to 01/05/2017
Breakout is upward 68% of the time.
Average rise: 39%.
Break-even failure rate: 9%.
Throwbacks occur 64% of the time.
Price hits measure rule target 80% of the time.
Thursday 1/5/17. Intraday Market Direction: Nasdaq
Average gain was 0.7% on 185 occasions.
Average loss was -0.9% on 93 occasions.
Expect the index to close higher 66.5% of the time.
Weekly, since inception on 6/14/2011:
The prediction of the index closing higher has been right 119/206 or 57.8% of the time.
The prediction of the index closing lower has been right 41/80 or 51.2% of the time.
Since I post this the night before, check how the futures are trading before market open. Large moves can affect the opening direction.

$ $ $
I show a picture of the Nasdaq composite on the 5-minute scale.
I drew two horizontal red lines. They are thin ones, because intraday support and resistance is weaker than on the daily charts. Regardless, the index might turn if it touches those lines.
Also, the blue trendline (A) is curved. This could signal a horizontal move. Clearly, it’s a slackening of upward momentum. Or it could mean the upward trend is over. In that case, it’s a
pullback. Normally, I associate pullbacks with the breakout from a chart pattern. I saw that on my daily charts today, hence the warning that a resumption of the
downward move might be coming.
The above probabilities suggest an upward move, though, a higher close on Thursday.
$ $ $
The following table shows where Fibonacci retrace values of the day’s high-low range are plus pivot points, calculated on the Nasdaq composite, sorted by value. When several are near each other (small differences),
the area might act as support or resistance.
— Thomas Bulkowski
| © 2017 ThePatternSite.com Metric | Value | Diff | Close (within 10% of the high-low range for the day)? |
| Monthly S2 | 5,135.03 | ||
| Monthly S1 | 5,306.02 | 170.98 | |
| Weekly S2 | 5,313.27 | 7.26 | |
| Weekly S1 | 5,395.14 | 81.86 | |
| Monthly Pivot | 5,409.19 | 14.06 | |
| Daily S2 | 5,424.42 | 15.23 | |
| Low | 5,440.24 | 15.82 | |
| Open | 5,440.91 | 0.67 | Yes! The Open is close to the Low. |
| Daily S1 | 5,450.71 | 9.80 | |
| Weekly Pivot | 5,453.75 | 3.04 | Yes! The Weekly Pivot is close to the Daily S1. |
| 61.8% Down from Intraday High | 5,456.33 | 2.57 | Yes! The 61.8% Down from Intraday High is close to the Weekly Pivot. |
| 50% Down from Intraday High | 5,461.29 | 4.97 | |
| 38.2% Down from Intraday High | 5,466.26 | 4.97 | |
| Daily Pivot | 5,466.53 | 0.27 | Yes! The Daily Pivot is close to the 38.2% Down from Intraday High. |
| Close | 5,477.00 | 10.47 | |
| High | 5,482.35 | 5.35 | |
| Daily R1 | 5,492.82 | 10.47 | |
| Daily R2 | 5,508.64 | 15.82 | |
| Weekly R1 | 5,535.62 | 26.98 | |
| Monthly R1 | 5,580.18 | 44.56 | |
| Weekly R2 | 5,594.23 | 14.06 | |
| Monthly R2 | 5,683.35 | 89.12 |
Wednesday 1/4/17. A Look At Indicators

This is a picture of the chart pattern indicator on the daily scale. The indicator is the line chart below a chart of the S&P 500 composite.
The chart pattern indicator signaled a bearish turn almost two trading weeks ago as the right red bar shows.
Notice, however, that the indicator has soared in the last three trading days. Hmm.
It could mean that as brief as this retrace has been, it will end soon. I’m not convinced that will happen. The move up from the November low was too far, too fast for such a brief retrace.

The red line is the percentage of stocks at least 20% below their 1-year high (plotted upside down). The blue line is the average percentage drop of stocks below their 1-year high (plotted upside down).
On Friday, 19% of stocks in my database are in bear market territory (down at least 20% from their 1-year high).
A week ago, it was 18%.
The fewest was 14% on 12/09/2016.
And the most was 70% on 02/11/2016.
The 519 stocks in my database are down an average of 12% from their yearly high.
A week ago, the average was 12%.
The peak was 10% on 12/09/2016.
And the bottom was 32% on 02/11/2016.
I drew two bright green lines on the chart. Perhaps you should wear shades while viewing. ![]()
Anyway, they highlight the trend of the two lines.
The downward trend is pronounced on the red line. That fell over the past week, but the blue line held steady. To me, they both suggest weakness in the index.
$ $ $
I released a new version of Patternz: 5.15. This version allows a moving average and the chart pattern indictor has options to make the chart clearer.
What else did you want in the program? Let me know by emailing me:
$ $ $
The time of my grandfather clock was slowing down an unusual amount so over the weekend I lubricated the mechanism. Now it won’t chime. Yes, the chime switch is on.
I used the same lube as I use on my bike chain. It’s a wax solution, and I thought it would work better (won’t collect dirt). But it turns out, the wax hardens (no surprise there) and freezes the flywheel controlling the chiming. Oops.
By jiggling the weight up and down, I was able to get it to work again without tearing it apart. In the past, I’ve used a 3-in-1 oil spray lubricant. That works, but only for a time.
— Thomas Bulkowski
Tuesday 1/3/17. The Year Behind and Ahead

This looks like it’s a complicated picture, but it’s not. Let’s go through it.
In my year ago blog post, I predicted the Dow industrials would close the year at 20,265. We fell just short of that, at 19,762.
That’s the first time that the prediction has been very very close.
This chart shows the Dow over the year and the prediction I made a year ago.
The prediction said we’d have a weak January followed by a move up going into April. The market would be week until mid July when it would gather strength to finish the year strongly.
Of course, the year started off weak and it started rising a month after the prediction (mid February instead of mid January).
Price bottomed in June, about two weeks ahead of schedule. It recovered but coasted lower until the straight-line run began in November.
| Annual Performance | |
|---|---|
| Dow transports | 20.4% |
| Dow utilities | 14.2% |
| Dow industrials | 13.4% |
| S&P 500 | 9.5% |
| Nasdaq | 7.5% |
For the historical record, here’s how the indices performed this year.
As the table on the right shows, the big winner was the Dow transports with a gain of 20.4% for the year.
Behind that, the utilities posted a good gain, 14.2%. None of these results include dividends, so
the utility index actually did better than that shown in the table.
The Dow industrials were close behind with a gain of 13.4%.
The Nasdaq ended the year in last place with a gain of 7.5%.

The above chart is what my software is predicting for 2017. The market should be strong until mid February where we peak (the first magenta line).
It’ll ease lower going into April and then shoot upward going into July.
The Dow will form a double top, peaking for the year in October before heading lower, closing the year at 21,265.
This picture doesn’t look bad but you should see what happens in 2018. After peak in 2017, the index will continue lower.
I’ll update the 10 year prediction here shortly, but you can visit the monthly forecast out to 2021 now. I made that in 2011.
Visit the link to learn how I made these predictions. And remember, they are rarely accurate. But if you need something to power your nightmares, the charts
at the link will help.
— Thomas Bulkowski
Written by and copyright © 2005-2017 by Thomas N. Bulkowski. All rights reserved. Disclaimer: You alone are responsible for your investment decisions.
See Privacy/Disclaimer for more information.
Source link
