 Best Stock Hints Latest Tips To Buy & Invest Best Stocks Today

We all know how much we pay in interest for a mortgage. We also all know how little we get from the so-called “high interest savings account” offered by the banks, and other financial institutions to be honest. But do you know what you could earn investing your hard earned money properly?
Have you ever asked yourself one of the following questions?
- What is the average return on investment in Canada?
- Is 3% a good return on investment?
- Is 5% return a good investment?
- Is 10% return on investment realistic?
The financial industry will try to give you an answer but usually, they are also trying to sell you a product which is sort of a conflict of interest.
I have spent years learning to become a better investor and navigate through all the sayings only to end up relying on what I have learned the hard way. Let me share my learnings.
What is the average return on investment in Canada?
We need to start with the benchmark. Today, in Canada, the benchmark is the TSX which is where the primary stocks trade on.
Interestingly enough, no ETF products track the full TSX today. The closest one I have found that covers the most stock is based on the S&P Global index called “S&P/TSX Capped Composite”.
For Canadians looking for a base benchmark to start from, that’s the one. What you can expect from a total return perspective comes from a passive investing approach using this broad Canadian index ETF with an approximate 7% return.
The average return on investment in Canada is approximately 7% today.
– iShares Core S&P/TSX Capped Composite Index ETF

That’s the baseline we are going to work with now. Even if you see an index showing a certain growth, what matters is the actual product you can buy that is closest to the benchmark.
Noteworthy: Most DYI investors do not know the performance of their investments. They go by the broker information and all they see is a percentage like 75%, or 236%, with a profit/loss percentage but none of it actually tells you the annual rate of return per investment.
Is 7% A Good Return On Investment?
Now that we have a baseline with an easy to follow index investing approach, is it a good return on investment?
Putting the number differently, and using the rule of 72, you would double your money in 10 years and 3 months. Not bad. It’s definitely better than what you can get from the bank.
The rule of 72 is important as it shows how long it takes to double your money. When we put time in perspective, it does change how we see what is a good return. Time translates into working years afterall …
– Dividend Earner
But is 7% good? Compared with interest rates from the bank, the answer is yes.
How does it compare with GICs (Guaranteed Investment Certificates)? It’s important to check as on one side you have risks, and on the other you have none.
Here is what CIBC offers in terms of GICs. The competition is probably similar plus / minus variantions.

Using the rule of 72 again, it would take a little over 15 years to double your money when you invest in those GICs. The iShares XIC ETF is still ahead. An additional 2.35% makes a big difference in how fast you can double your money.
Homework: Check your annual rate of return from your discount broker. Look at it per account and overall to see how you compare. Below is the report from RBC for my portfolio.


Is The Stock Market Risk Worth The Reward?
Is the stock market risk now worth it?
You are talking an extra 5 years to double the first time, but it’s also another 5 years to double again later. We are talking 20 years to double twice with the Canadian index ETF instead of 30 with a GIC, or 10 more years of hard labor.
Conservative and risk averse investors can be satisfied with 5%. In the end, it dictates when you can retire. While 5% is ok, 7% is probably good in general as it also represents the average performance of the TSX.
Since most investors cannot beat the index, most would be better off with 7% invested for 30 years.
Homework: When you start investing, there is no need to complicate everything. Just pick an index and get started with a no fee trading platform. Take a moment, and ask yourself if you can buy one index ETF and build it up to $100,000. If you have been investing for a while, review your rate of return, and ask the right question on your investment.
Is 10% Return On Investment Possible?
We have seen that Canada offers a 7% return from the stock market in general. To do better in Canada, you need to look at specialized investments and then the risk goes up.
Luckily, Canadians have easy access to the US markets. Following the same approach as the TSX, lets review the major index in the US and the products tracking them.
Using the S&P 500 index, which covers the major blue chip stocks in the US, you can get some solid results. Unfortunately, none of the ETFs tracking the S&P500 were created before 2008.
The XUS ETF from iShares has 14% return since 2013 while the Vanguard VFV ETF has 15% return since 2012. However, since none invested through 2008, we have fat years mostly for returns. Adding BMO ZUE, we go back to May 9, 2009 with 11%.


Using the rule of 72 again with 11% from BMO ZUE, you can double your money in 6 years and 6 months. It’s almost 4 years faster than the TSX. Again, how long do you want to work before you reach your retirement number?
Even without taking risks with indivudual stocks, you can get 10% return by investing in one of the largest economy in the world. It’s possible and pretty easy to accomplish.
As Canadians, why not just invest in the S&P 500 then? Well it has to do with being Canadian and biases. You have to fight your urge to hold Canadian holdings but there is also the tax implication depending on the account you invest in.
Homework: Ask yourself what is holding you back from just holding the one ETF? Use it as your benchmark if your holdings do not keep up during the accumulation years.
Can You Get 10% Return Annually With Dividend Stocks?
Now that we have establish a broad stock market index can give you 10% return on investment annually, or at least between 7% and 10%, what about when you invest in individual dividend stocks?
The idea here is to have a buy and hold list of dividend stocks as opposed to the Tesla (or the next one) aim for the sky investment. We are also not talking about income stocks for retirement.
Dividend Income Stocks During Accumulation
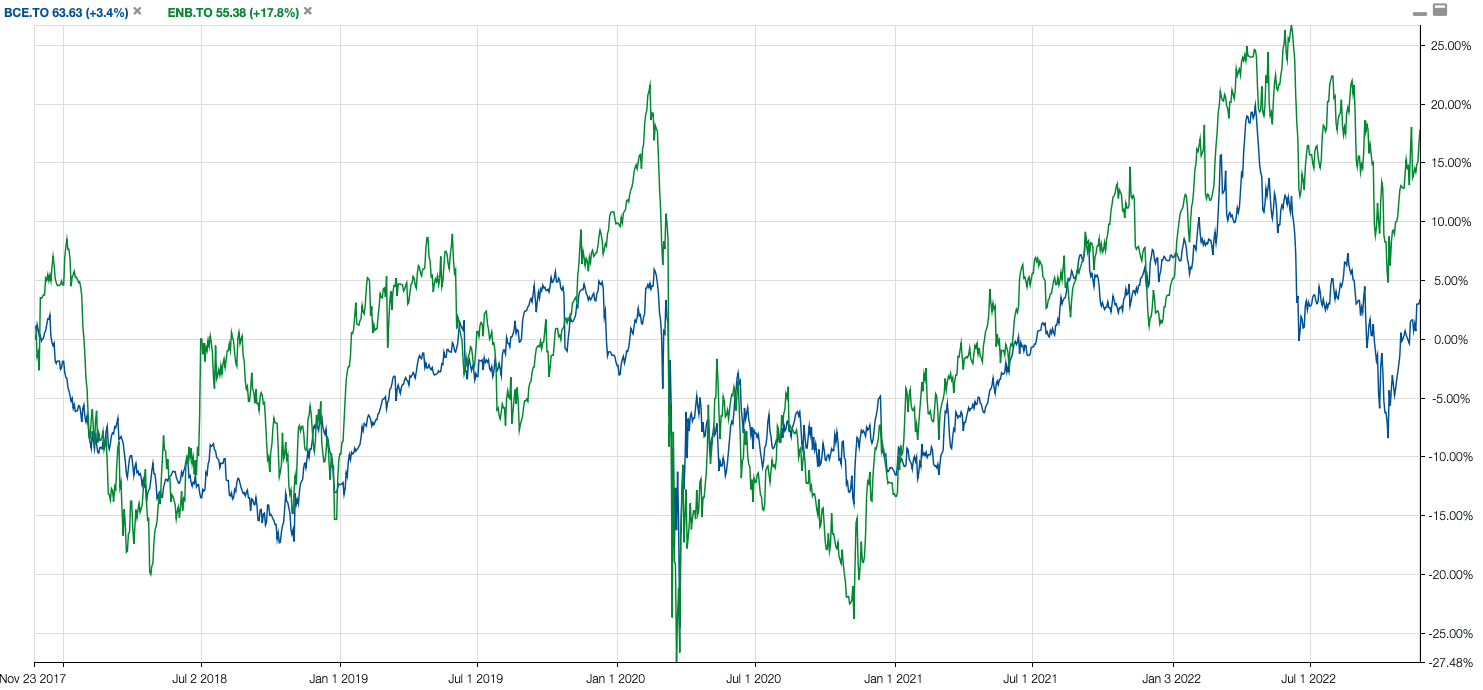
We should talk about what holding BCE with a 5% yield does. Many investors buy BCE for their portfolio in their 30’s relying on the yield as a baseline of return.
The saying is that I get at least 5% no matter what … Does that mean that 5% return on investment is good? In this case, you are almost better off buying a GIC today. But yesterday GICs did not offer 5% … That’s why income investors shift their holdings by the way … When interest rates go up, they move their money from stocks to GICs due to the risk reward nature.
Back to BCE, since the mental model is to DRIP the dividends and compound it for growth, investors often ignore the growth in stock price.
Below you can see two favorite holdings of many driven by the yield. The first graph is purely the stock price and BCE has 3.4% growth in 5 years whereas ENB has 17%. Now, 17% in 5 years isn’t much and 3.4% doesn’t keep up with inflation.
When dividend are reinvested, compouding is at work, and you get 36% growth in 5 years for BCE and 62% for ENB.
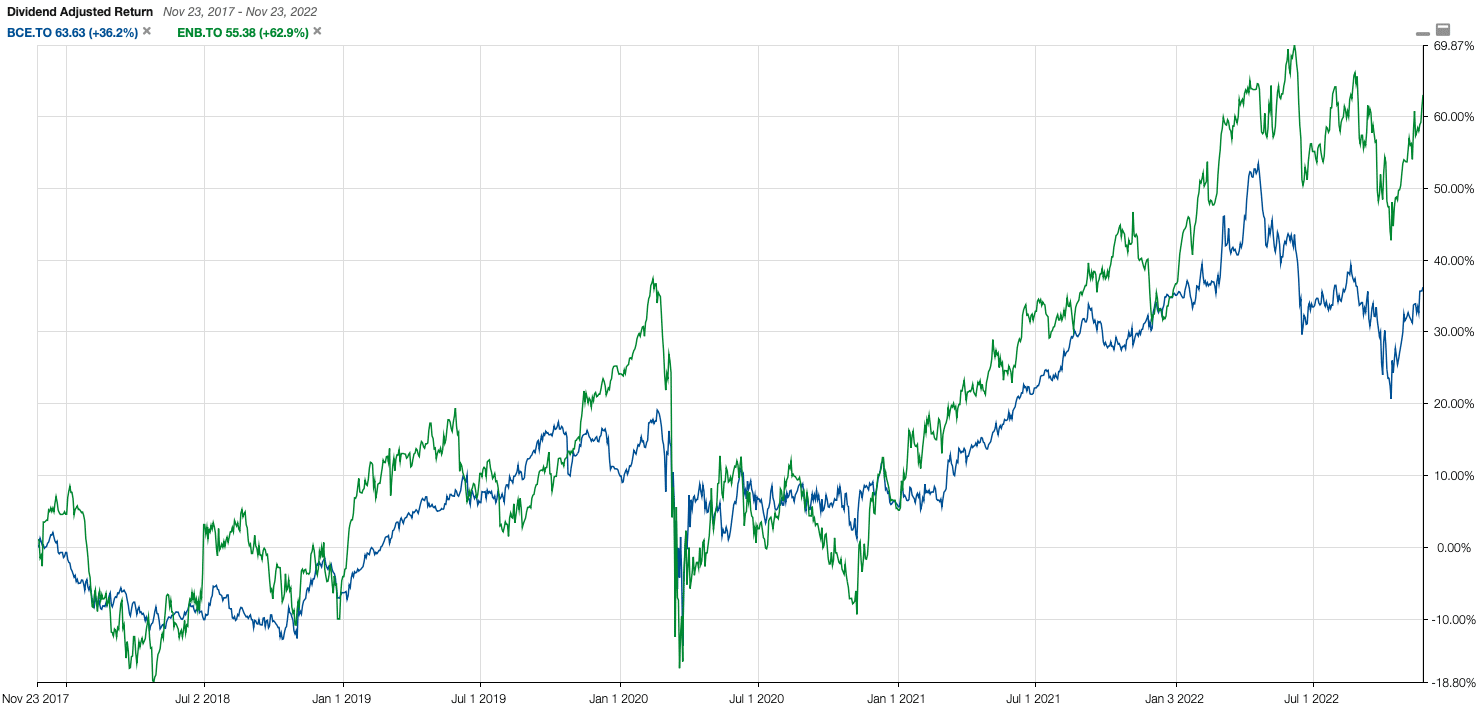
The total return with dividend might seem good for five years but if you hold the S&P500 ETF you would be ahead of both. Here is a table showing 5 and 10 year annualized returns for popular income stocks. It’s slightly better than the Canadian index and you take on more risks with individual holdings.
Dividend Growth Stocks Win
When it comes to grow your portfolio, you can see the inverse relationship of the yield and the annualize return with the banks striking a middle ground.
Higher yield ususally implies less growth which means less appreciation and higher dividend growth, it usually means there is still growth and the yield tends to be lower as more money is reinvested in the business.
As you can see, it’s pretty easy to find a solid business that can provide you with 10% annualized return. With a good stock screener, you can easily find stocks and manage risks by market capitalization as well.
10% annualized return is possible and pretty easy to target. The biggest challenge investors have to achieving those results are themselves when they try something different and deviate from the plan. It’s also easier when you invest in US holdings. Not many Canadian stocks have continous growth …
Build Your TFSA With 10% Return
It’s very simple. Every year, deposit the maxium and buy the Vanguard VFV S&P 500 Index and you are set.
Check out the table below and see how fast 10% will grow your portfolio.
| 1 | 2009 | 5,000 | 5,000 | 5,250 | 5,500 | Not Tracked | Not Started |
| 2 | 2010 | 5,000 | 10,000 | 10,762 | 11,550 | Not Tracked | Not Started |
| 3 | 2011 | 5,000 | 15,000 | 16,550 | 18,205 | Not Tracked | Not Started |
| 4 | 2012 | 5,000 | 20,000 | 22,628 | 25,525 | Not Tracked | Not Started |
| 5 | 2013 | 5,500 | 25,500 | 29,534 | 34,128 | $41,742 | Not Started |
| 6 | 2014 | 5,500 | 31,000 | 36,786 | 43,590 | $52,820 | Not Started |
| 7 | 2015 | 10,000 | 41,000 | 49,125 | 58,949 | $56,307 | Not Started |
| 8 | 2016 | 5,500 | 46,500 | 57,356 | 70,984 | $70,200 | Not Started |
| 9 | 2017 | 5,500 | 52,000 | 65,999 | 84,034 | $78,900 | $13,308 |
| 10 | 2018 | 5,500 | 57,500 | 75,074 | 98,487 | $96,937 | $58,818 |
| 11 | 2019 | 6,000 | 63,500 | 85,128 | 114,986 | $129,467 | $82,596 |
| 12 | 2020 | 6,000 | 69,500 | 95,684 | 133,030 | $153,993 | $95,906 |
| 13 | 2021 | 6,000 | 75,500 | 106,769 | 152,933 | $181,601 | $113,194 |
| 14 | 2022 | 6,000 | 81,500 | 118,407 | 174,827 | $183,031 | $144,633 |
| 15 | 2023 | 6,500 | 88,000 | 131,152 | 199,459 | $177,177 YTD | $144,624 YTD |
| 16 | 2024 | 6,500 | 94,500 | 144,536 | 226,555 | ||
| 17 | 2025 | 6,500 | 101,000 | 158,587 | 256,361 | ||
| 18 | 2026 | 6,500 | 107,500 | 173,342 | 289,147 | ||
| 19 | 2027 | 7,000 | 114,500 | 189,359 | 325,762 | ||
| 20 | 2028 | 7,000 | 121,500 | 206,177 | 366,038 | ||
| 21 | 2029 | 7,000 | 128,500 | 223,836 | 410,342 | ||
| 22 | 2030 | 7,500 | 136,000 | 242,902 | 459,626 | ||
| 23 | 2031 | 7,500 | 143,500 | 262,923 | 513,838 | ||
| 24 | 2032 | 7,500 | 151,000 | 283,944 | 573,472 | ||
| 25 | 2033 | 7,500 | 158,500 | 306,016 | 639,069 | ||
| 26 | 2034 | 7,500 | 166,000 | 329,192 | 711,226 | ||
| 27 | 2035 | 7,500 | 173,500 | 353,526 | 790,599 | ||
| 28 | 2036 | 7,500 | 181,000 | 379,078 | 877,909 | ||
| 29 | 2037 | 7,500 | 188,500 | 405,906 | 973,950 | ||
| 30 | 2038 | 7,500 | 196,000 | 434,077 | 1,079,595 |
Source link